Intro
Understanding rank and percentile is crucial in data analysis, as it allows us to comprehend the position of a value within a dataset relative to other values. In Excel, calculating rank and percentile can be achieved through various functions and methods. This article delves into the importance of rank and percentile, their applications, and how to calculate them using Excel.
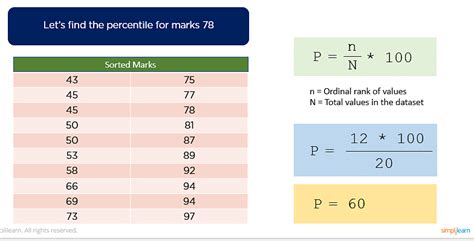
Rank and percentile are fundamental concepts in statistics and data analysis. The rank of a value indicates its position when the dataset is sorted in ascending or descending order. Percentile, on the other hand, shows the percentage of values in the dataset that are below a specific value. These concepts are vital in understanding the distribution of data, identifying outliers, and making informed decisions based on data analysis.
In many fields, including education, finance, and healthcare, rank and percentile are used to evaluate performance, risk, and trends. For instance, in education, students' scores are often ranked to determine their position in the class or school. In finance, the percentile of stock prices can help investors understand the volatility and potential risk of their investments. Thus, mastering the calculation and interpretation of rank and percentile is essential for anyone working with data.
Introduction to Rank in Excel
The RANK function in Excel is used to return the rank of a number within a list of numbers. The syntax of the RANK function is RANK(number, ref, [order]), where "number" is the number for which you want to find the rank, "ref" is the array of numbers, and "[order]" is optional, specifying the order of ranking (ascending or descending). If [order] is omitted or set to 0, the ranking is in descending order, meaning the largest number gets rank 1. If [order] is set to any non-zero value, the ranking is in ascending order.
Calculating Rank in Excel
To calculate the rank of a value in Excel, follow these steps: 1. Identify the value for which you want to find the rank and the range of cells containing the dataset. 2. Use the RANK function by typing "=RANK(" and then select the cell containing the value, followed by the range of the dataset, and optionally, the order. 3. Press Enter to get the rank.For example, if you have a list of scores in cells A1 through A10 and you want to find the rank of the score in cell A5 in ascending order, you would use the formula "=RANK(A5, A1:A10, 1)".
Introduction to Percentile in Excel
The PERCENTRANK function in Excel returns the percentage rank of a value within a list of values. The syntax is PERCENTRANK(array, x, [significance]), where "array" is the range of data, "x" is the value for which you want to find the percentile rank, and "[significance]" is optional, specifying the number of significant digits.
Calculating Percentile in Excel
To calculate the percentile of a value in Excel, follow these steps: 1. Identify the value for which you want to find the percentile and the range of cells containing the dataset. 2. Use the PERCENTRANK function by typing "=PERCENTRANK(" and then select the range of the dataset, followed by the cell containing the value, and optionally, the significance. 3. Press Enter to get the percentile.For example, if you have a list of scores in cells A1 through A10 and you want to find the percentile rank of the score in cell A5, you would use the formula "=PERCENTRANK(A1:A10, A5)".
Applications of Rank and Percentile
Rank and percentile have numerous applications across various fields. In education, they are used to evaluate student performance and progress. In finance, they help in assessing investment risks and returns. In healthcare, they are utilized to understand the distribution of disease prevalence and treatment outcomes.
Some key applications include:
- Performance Evaluation: Rank and percentile are used to compare the performance of individuals or groups within a larger dataset.
- Risk Assessment: In finance and insurance, percentile is used to assess the risk associated with investments or policies.
- Data Analysis: Understanding the rank and percentile of values within a dataset helps in identifying outliers, trends, and patterns.
Benefits of Using Rank and Percentile
Using rank and percentile in data analysis offers several benefits: - **Comparability:** Allows for the comparison of different datasets or values within a dataset. - **Simplified Decision Making:** Provides a clear, quantifiable measure to support decisions. - **Data Interpretation:** Enhances the understanding of data distribution and trends.Advanced Topics in Rank and Percentile Calculation
Beyond the basic functions, Excel offers advanced methods for calculating rank and percentile, including the use of arrays and the PERCENTILE and QUARTILE functions for more complex percentile calculations.
Using PERCENTILE and QUARTILE Functions
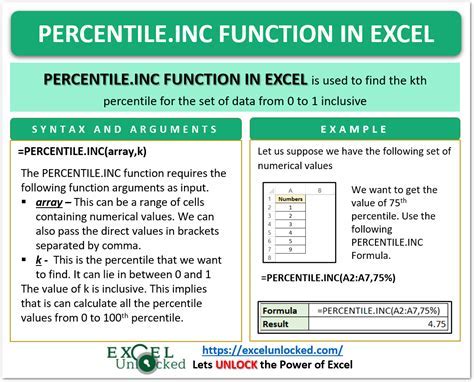
The PERCENTILE and QUARTILE functions in Excel are used for more specific percentile calculations: - **PERCENTILE:** Returns the value at a specific percentile. - **QUARTILE:** Returns the value at a specific quartile (25%, 50%, or 75%).These functions are useful for understanding the distribution of data and can be applied in various scenarios, such as financial analysis, where understanding quartiles can help in assessing investment performance.
Gallery of Rank and Percentile Examples
Rank and Percentile Image Gallery


Frequently Asked Questions
What is the difference between rank and percentile?
+Rank refers to the position of a value within a dataset when it is sorted, while percentile indicates the percentage of values below a specific value.
How do I calculate rank in Excel?
+You can calculate rank using the RANK function, specifying the value, the range of the dataset, and optionally, the order of ranking.
What are the applications of percentile in data analysis?
+Percentile is used in evaluating performance, assessing risk, and understanding data distribution. It's crucial in finance, education, and healthcare for informed decision-making.
In conclusion, understanding and calculating rank and percentile are essential skills for anyone involved in data analysis. Excel provides powerful functions like RANK and PERCENTRANK to facilitate these calculations. By mastering these concepts and functions, individuals can enhance their ability to interpret data, make informed decisions, and contribute to their respective fields more effectively. We invite readers to share their experiences with rank and percentile calculations in Excel and explore how these concepts can be applied in various real-world scenarios.