Intro
Learn to calculate Excel Pivot Table percentage of total with ease. Discover how to create dynamic reports using pivot tables, percentage calculations, and data analysis techniques to visualize totals and summaries.
When working with data in Excel, pivot tables are an essential tool for summarizing and analyzing large datasets. One common requirement is to calculate the percentage of total for a particular field in a pivot table. This can help in understanding how different categories contribute to the overall total. In this article, we will delve into the world of Excel pivot tables, focusing on how to calculate the percentage of total for a field, and explore various scenarios and examples to make the most out of this powerful feature.
To begin with, let's consider why calculating percentages in pivot tables is useful. Percentages allow us to see the relative contribution of each category to the total, making it easier to compare different segments of our data. For instance, if we have sales data by region, calculating the percentage of total sales for each region helps us understand which regions are performing better and where we might need to focus our efforts.
Creating a Pivot Table
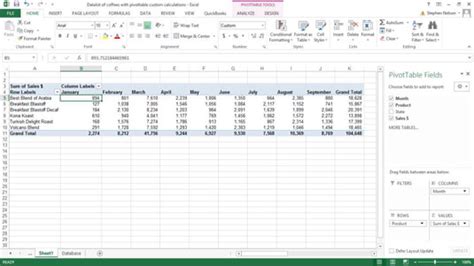
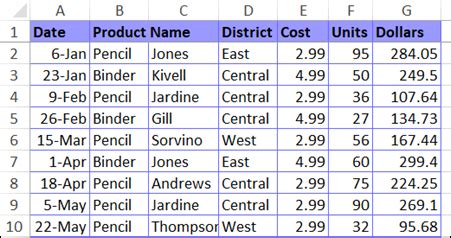
Before we dive into calculating percentages, let's quickly cover how to create a pivot table. To create a pivot table, select a cell in your data range, go to the "Insert" tab on the ribbon, and click on "PivotTable." Choose a location for your pivot table and select the data range you want to analyze. Excel will then create a blank pivot table, ready for you to add fields.
Calculating Percentage of Total
To calculate the percentage of total for a field in your pivot table, follow these steps:
- Ensure your pivot table is set up with the field you want to calculate the percentage for in the "Values" area of the pivot table fields list.
- Right-click on the field in the "Values" area for which you want to calculate the percentage.
- From the context menu, select "Value Field Settings."
- In the "Value Field Settings" dialog, go to the "Show values as" tab.
- Select "% of Grand Total" from the dropdown list.
- Click "OK" to apply the change.
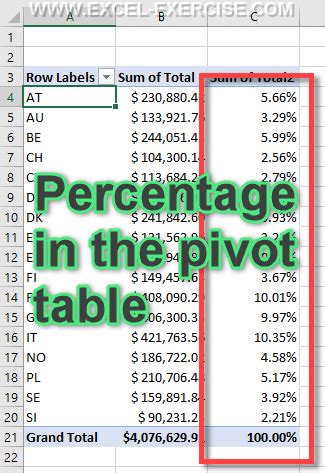
This will display the values in your pivot table as percentages of the grand total, allowing you to see the relative contribution of each category.
Understanding the "% of Grand Total" Option
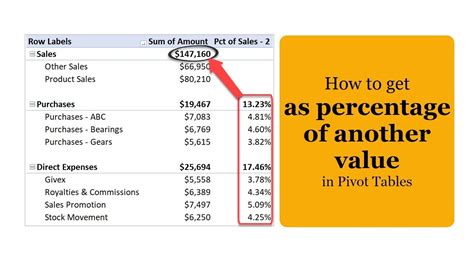
The "% of Grand Total" option calculates the percentage of each value in the selected field relative to the grand total of all values in that field across the entire pivot table. This is useful for comparing the size of different categories within your data.Custom Calculations
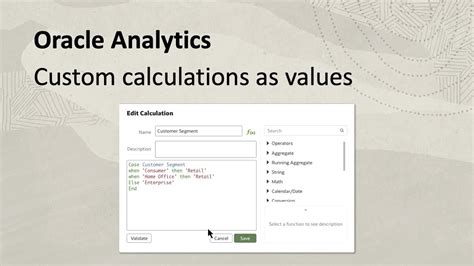
Sometimes, you might need to perform custom calculations that aren't directly available in the pivot table settings. Excel allows you to create custom calculations using the "Calculate" field in the pivot table. However, for calculating percentages of totals, the built-in "% of Grand Total" option is usually sufficient.
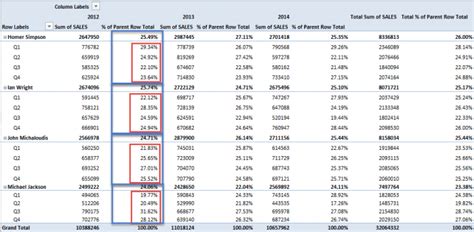
Using the "% of Row Total" and "% of Column Total" Options
In addition to "% of Grand Total," Excel also offers "% of Row Total" and "% of Column Total" options. These can be useful in different scenarios: - "% of Row Total" calculates the percentage of each value in the row relative to the total of that row. - "% of Column Total" calculates the percentage of each value in the column relative to the total of that column.These options are selected in the same manner as "% of Grand Total" but offer more flexibility in how you analyze your data.
Practical Examples
Let's consider a few practical examples to illustrate the use of percentage calculations in pivot tables:
- Regional Sales Analysis: If you have a dataset of sales by region, you can use the "% of Grand Total" option to see which regions contribute the most to your total sales.
- Product Category Analysis: For a dataset of sales by product category, calculating the percentage of total sales for each category helps in identifying best-selling categories.
- Time-Based Analysis: If your data includes sales figures over time, you can calculate the percentage of total sales for each period (e.g., month, quarter) to analyze trends.
Benefits of Percentage Calculations
Calculating percentages in pivot tables offers several benefits, including: - **Easy Comparison**: Percentages make it easy to compare different categories or time periods. - **Trend Analysis**: By looking at how percentages change over time, you can identify trends in your data. - **Decision Making**: Percentage calculations can inform business decisions by highlighting areas of strength and weakness.Gallery of Excel Pivot Table Percentage Calculations
Excel Pivot Table Percentage Calculations Image Gallery


Frequently Asked Questions
How do I create a pivot table in Excel?
+To create a pivot table, select a cell in your data range, go to the "Insert" tab, and click on "PivotTable." Then, choose a location for your pivot table and select the data range you want to analyze.
What is the "% of Grand Total" option used for in pivot tables?
+The "% of Grand Total" option calculates the percentage of each value in the selected field relative to the grand total of all values in that field across the entire pivot table.
How do I calculate the percentage of row total in a pivot table?
+To calculate the percentage of row total, right-click on the field in the "Values" area, select "Value Field Settings," go to the "Show values as" tab, and choose "% of Row Total" from the dropdown list.
In conclusion, calculating percentages in Excel pivot tables is a powerful way to analyze and understand your data. By using the "% of Grand Total," "% of Row Total," and "% of Column Total" options, you can gain insights into how different categories contribute to your overall totals. Remember, the key to effective data analysis is to make your data tell a story, and percentages are a crucial part of that narrative. Whether you're analyzing sales, customer behavior, or any other type of data, mastering pivot table percentage calculations will take your analysis to the next level. So, go ahead, dive into the world of pivot tables, and start uncovering the stories hidden within your data. Don't forget to share your experiences and tips on using pivot tables for percentage calculations in the comments below!