Intro
Calculate forecast accuracy with Mean Absolute Error in Excel, using formulas and functions to measure prediction errors, residuals, and deviations, improving model evaluation and statistical analysis.
The Mean Absolute Error (MAE) is a widely used metric in statistics and data analysis to measure the average difference between predicted and actual values. In Excel, calculating the MAE is a straightforward process that can be achieved using various methods. Understanding and applying the MAE in Excel can significantly enhance data analysis capabilities, especially in forecasting, regression analysis, and model evaluation.
To begin with, the MAE is an important metric because it provides an unbiased measure of the average magnitude of the errors in a set of predictions, without considering their direction. This is particularly useful in scenarios where the direction of the error does not matter, and what is of interest is the magnitude of the difference between predicted and actual values.
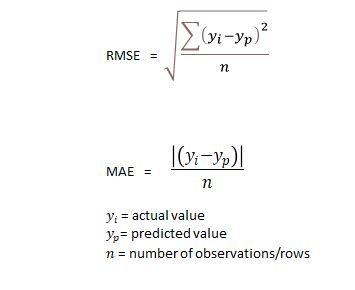
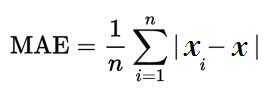
The formula for calculating the MAE is simple: it is the average of the absolute differences between forecasted and actual values. Mathematically, this can be represented as the sum of the absolute differences between predicted (P) and actual (A) values for each data point, divided by the number of observations (n). The formula looks like this: MAE = (1/n) * Σ|P - A|.
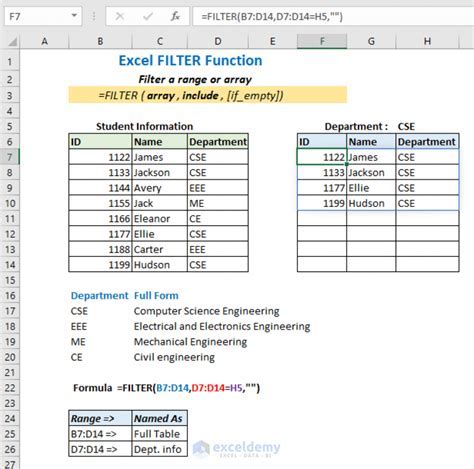
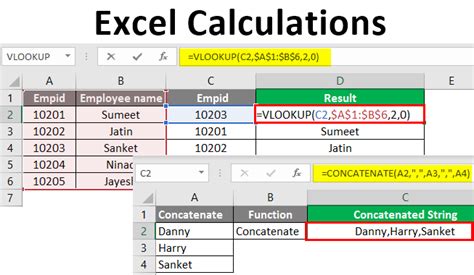
In Excel, there are several ways to calculate the MAE, including using formulas, functions, and even add-ins for more complex analyses. One of the most straightforward methods is to use the AVERAGE and ABS functions in combination. First, you calculate the absolute difference between each pair of predicted and actual values using the ABS function, and then you average these differences using the AVERAGE function.
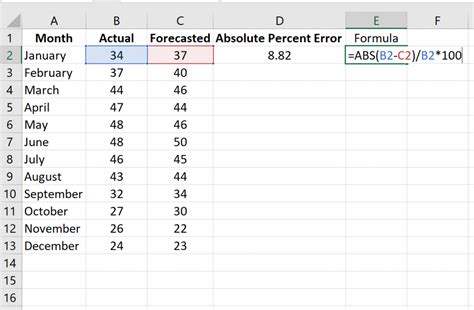
For instance, if your predicted values are in column B and your actual values are in column C, you can calculate the absolute differences in column D using the formula =ABS(B2-C2) and then drag this formula down for all your data points. After that, you can calculate the MAE by averaging these absolute differences with the formula =AVERAGE(D2:D100), assuming your data ranges from row 2 to row 100.
Calculating Mean Absolute Error in Excel
Another approach to calculating the MAE in Excel involves using an array formula. This method is more concise and can be entered as a single formula without the need for a helper column. The array formula for MAE is =AVERAGE(ABS(B2:B100-C2:C100)), where B2:B100 contains the predicted values and C2:C100 contains the actual values. To enter this as an array formula, you press Ctrl+Shift+Enter instead of just Enter.
Using Array Formulas for MAE
In addition to these manual methods, Excel also offers the Forecast Sheet tool and the Excel Analysis ToolPak, which can be used for more advanced forecasting and regression analyses, including the calculation of the MAE. These tools provide a more automated approach to data analysis and can be particularly useful for large datasets or complex models.
Advanced Tools for MAE Calculation
When interpreting the MAE, it's essential to understand that a lower MAE indicates better forecasting performance, as it means the predicted values are closer to the actual values on average. However, the MAE should be considered in the context of the data and the forecasting model used. Comparing the MAE across different models or datasets can provide insights into which model performs better in terms of prediction accuracy.
Interpreting Mean Absolute Error

Furthermore, the MAE can be used in conjunction with other metrics, such as the Mean Absolute Percentage Error (MAPE) or the Root Mean Squared Error (RMSE), to get a more comprehensive view of a model's performance. Each of these metrics provides a different perspective on the errors, allowing for a more nuanced evaluation of forecasting accuracy.
Combining MAE with Other Metrics
In practical applications, the MAE is widely used in various fields, including finance, economics, engineering, and environmental science, wherever forecasting and prediction are critical. For instance, in finance, the MAE can be used to evaluate the performance of stock price predictions or forecasting models for economic indicators. In environmental science, it might be used to assess the accuracy of climate models or air quality predictions.
Practical Applications of MAE

In conclusion, calculating and interpreting the Mean Absolute Error in Excel is a valuable skill for anyone involved in data analysis, forecasting, or model evaluation. By understanding how to calculate the MAE using various methods in Excel and how to interpret its results, analysts can make more informed decisions and improve the accuracy of their predictions.
Final Thoughts on MAE in Excel
Mean Absolute Error Image Gallery


What is the Mean Absolute Error (MAE)?
+The Mean Absolute Error (MAE) is a measure of the average magnitude of the errors in a set of predictions, without considering their direction.
How do I calculate the MAE in Excel?
+You can calculate the MAE in Excel by using the AVERAGE and ABS functions, or by using an array formula that combines these operations.
What are the practical applications of the MAE?
+The MAE has practical applications in finance, economics, engineering, and environmental science, wherever forecasting and prediction are critical.
We hope this comprehensive guide to the Mean Absolute Error in Excel has been informative and helpful. Whether you're a seasoned data analyst or just starting out with forecasting and prediction, understanding the MAE and how to apply it in Excel can significantly enhance your skills and the accuracy of your predictions. Feel free to share your thoughts, ask questions, or explore more topics related to data analysis and Excel applications.