Intro
The concept of supply and demand is a fundamental principle in economics, describing the relationship between the availability of a product or service and the desire for it among consumers. Graphing supply and demand in Excel can help visualize this relationship, making it easier to understand and analyze market trends. Here's a step-by-step guide on how to create a supply and demand graph in Excel.
To start, you need some data on the price of a product and the corresponding quantities that suppliers are willing to supply and consumers are willing to demand at those prices. For simplicity, let's use hypothetical data.
Understanding Supply and Demand Basics

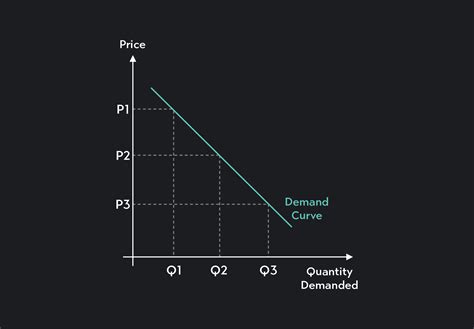
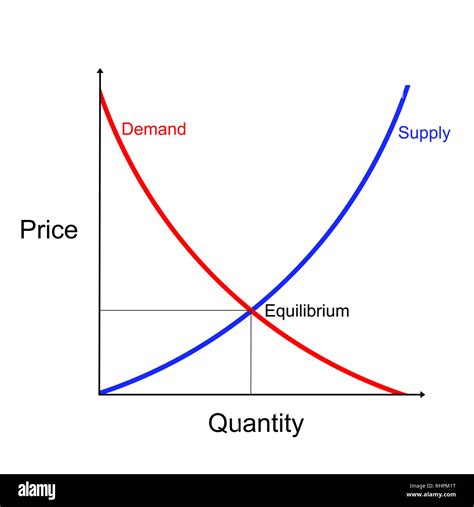
Before creating the graph, it's essential to understand the basics of supply and demand. The law of demand states that as the price of a product increases, the quantity demanded decreases, and vice versa, assuming all other factors remain constant. The law of supply states that as the price of a product increases, the quantity supplied also increases, because higher prices make it more profitable for producers to supply the product.
Preparing Your Data in Excel
-
Open Excel and create a new spreadsheet.
-
Set up your data table. In the first column (A), list the prices of the product. In the second column (B), enter the quantities demanded at each price point. In the third column (C), enter the quantities supplied at each price point.
For example:
- Column A (Price): $1, $2, $3, $4, $5
- Column B (Quantity Demanded): 100, 80, 60, 40, 20
- Column C (Quantity Supplied): 20, 40, 60, 80, 100
Creating the Supply and Demand Graph
- Select the data range, including the headers (A1:C6, assuming your data starts from row 1 and ends at row 6).
- Go to the "Insert" tab on the Ribbon.
- Click on the "Scatter" button in the "Charts" group.
- Choose a scatter plot with only markers (no lines) for both the demand and supply data. You might need to adjust the chart type in the "Chart Tools" tab after creating it.
- Right-click on the chart and select "Select Data."
- In the "Select Data Source" dialog, you can adjust the series. Click "Add" to add a new series for supply if it's not already included.
- For each series, choose the corresponding data range for the X values (prices) and the Y values (quantities).
- After setting up both series, click "OK."
Customizing Your Graph
- Title and Labels: Double-click on the chart title to edit it. You can also add axis titles by clicking on the chart, then going to the "Chart Tools" tab, and using the "Axis Titles" button.
- Legend: You can customize the legend's position or format by clicking on it and using the options in the "Chart Tools" tab.
- Gridlines: Adding gridlines can make the chart easier to read. You can do this by clicking on the chart, then using the "Gridlines" button in the "Chart Tools" tab.
Interpreting the Supply and Demand Graph
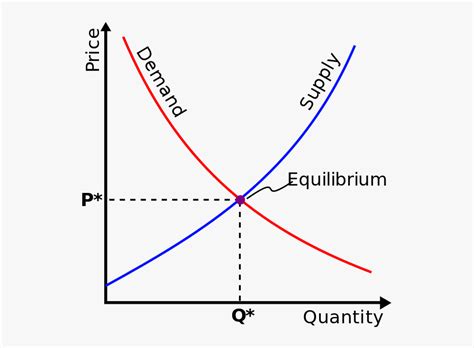
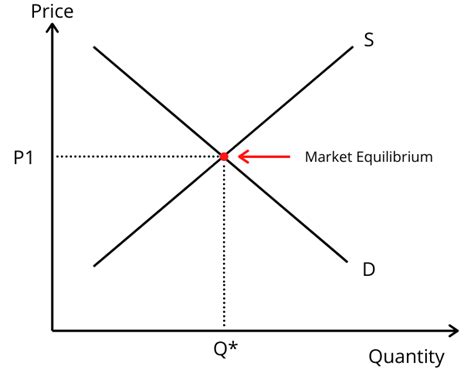
The point where the supply and demand curves intersect is the market equilibrium. At this price and quantity, the market is in balance—there is no tendency for the price to rise or fall because the quantity of the product that consumers are willing to buy equals the quantity that producers are willing to supply.
Advanced Analysis and Applications

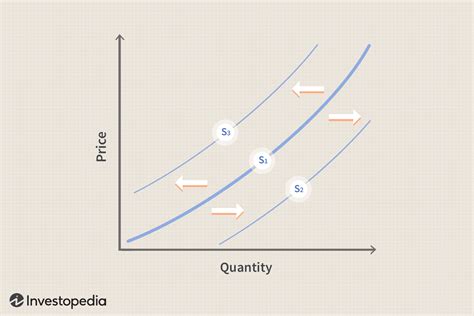
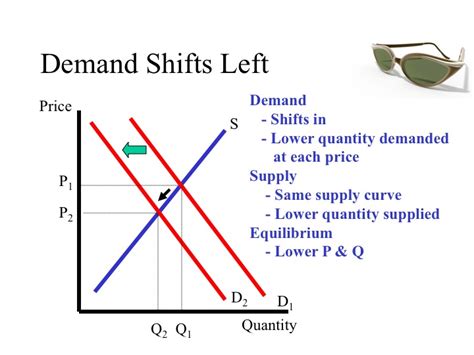
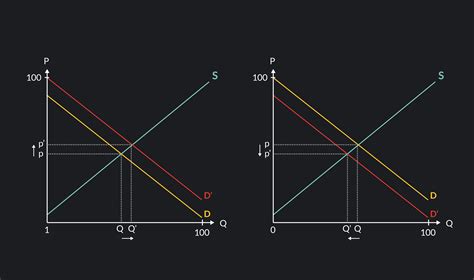
Understanding supply and demand is crucial for businesses and policymakers. By analyzing shifts in the supply and demand curves, one can predict changes in prices and quantities. For example, an increase in demand (a shift of the demand curve to the right) can lead to higher prices and quantities, assuming supply remains constant. Conversely, an increase in supply (a shift of the supply curve to the right) can lead to lower prices and higher quantities if demand remains constant.
Gallery of Supply and Demand Examples
Supply and Demand Image Gallery

What is the law of demand?
+The law of demand states that as the price of a product increases, the quantity demanded decreases, assuming all other factors remain constant.
How do you calculate market equilibrium?
+Market equilibrium is calculated by finding the point where the supply and demand curves intersect, which represents the price and quantity at which the quantity supplied equals the quantity demanded.
What happens when demand increases?
+An increase in demand shifts the demand curve to the right. If supply remains constant, this leads to a higher market price and an increase in the quantity traded.
In conclusion, creating a supply and demand graph in Excel is a straightforward process that can greatly aid in understanding market dynamics. By analyzing shifts in supply and demand curves, individuals can better predict changes in market prices and quantities. Whether you're a student of economics, a business professional, or simply interested in how markets work, mastering the concept of supply and demand is essential. Share your thoughts on the importance of understanding supply and demand, and don't hesitate to reach out if you have any questions or need further clarification on creating supply and demand graphs in Excel.