Intro
Master Excels sum same category feature to efficiently calculate and analyze data. Learn formulas and functions for grouping and summing similar categories, including PivotTables and SUMIF.
The ability to sum values in the same category is a fundamental aspect of data analysis in Excel. This operation is crucial for understanding and summarizing large datasets, making it easier to draw insights and make informed decisions. Excel provides several methods to achieve this, including using formulas, pivot tables, and conditional sum functions. Here, we'll delve into the details of how to sum values in the same category using these methods.
To begin with, let's consider a basic scenario where you have a list of items, each belonging to a specific category, and you want to sum up the values for each category. For instance, you might have a list of sales data where each row represents a sale, with columns for the category of the item sold and the amount of the sale. Your goal is to find the total sales for each category.
Using Formulas
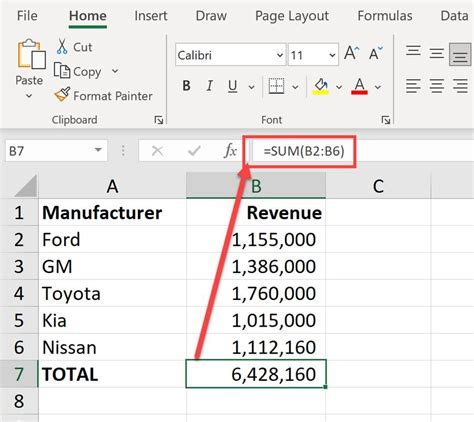
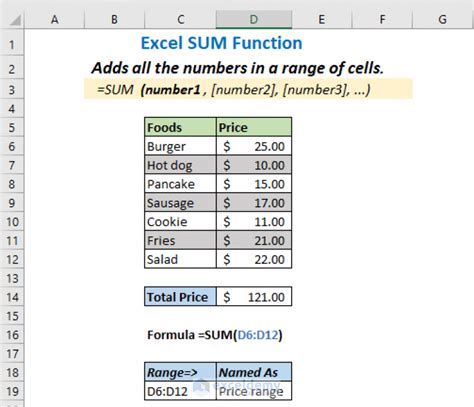
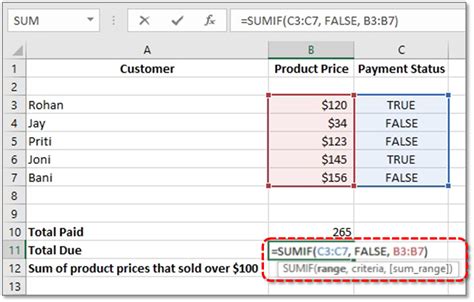
One of the straightforward ways to sum values in the same category is by using formulas. Excel's SUMIF function is particularly useful for this purpose. The syntax for SUMIF is SUMIF(range, criteria, [sum_range]), where range is the range of cells that you want to apply the criteria against, criteria is the criteria in the form of a number, expression, cell reference, or text that defines which cells will be added, and [sum_range] is the actual cells to sum, which is optional if you want to sum the values in the range specified in the first argument.
For example, if your categories are listed in column A and the values you want to sum are in column B, and you want to sum all values for the category "Electronics", you could use the following formula:
=SUMIF(A:A, "Electronics", B:B)
This formula sums all the values in column B for the rows where the category in column A is "Electronics".
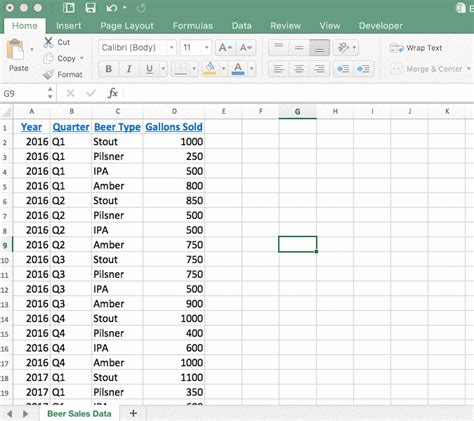
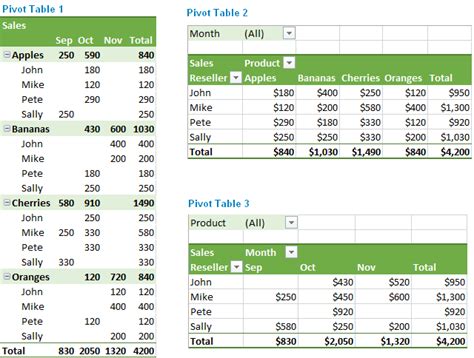
Using Pivot Tables
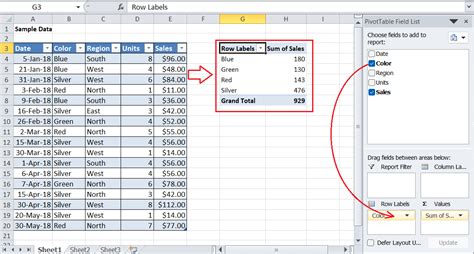
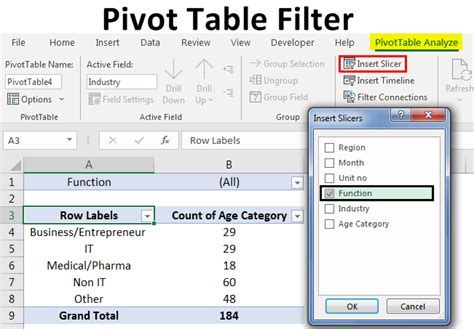
Pivot tables offer a powerful and flexible way to summarize data, including summing values by category. To create a pivot table:
- Select your data range, including headers.
- Go to the "Insert" tab on the Ribbon and click on "PivotTable".
- Choose a location for your pivot table and click "OK".
- In the PivotTable Fields pane, drag your category field to the "Row Labels" area and your value field to the "Values" area.
By default, Excel will sum the values for each category, providing a neat summary of your data. You can further customize your pivot table by applying filters, changing the summary function (e.g., from sum to average), and more.
Using Conditional Sum Functions
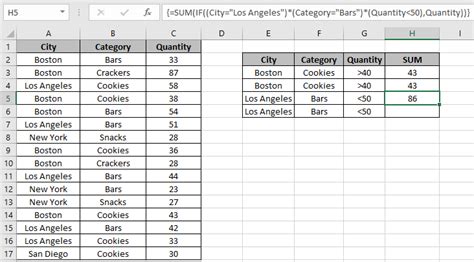
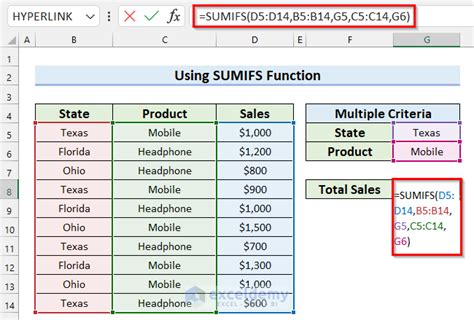
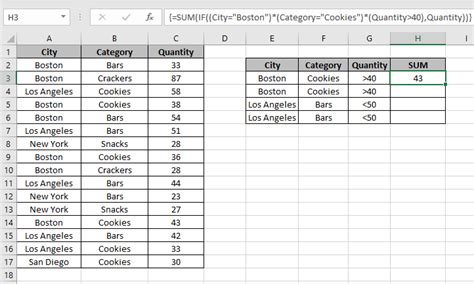
Besides SUMIF, Excel offers other conditional sum functions like SUMIFS (which allows multiple criteria ranges and criteria), SUMIF with multiple criteria using arrays, and the DSUM function for database functions.
SUMIFSis useful when you need to apply multiple criteria across different ranges. Its syntax isSUMIFS(sum_range, criteria_range1, criteria1, [criteria_range2], [criteria2],...).- The
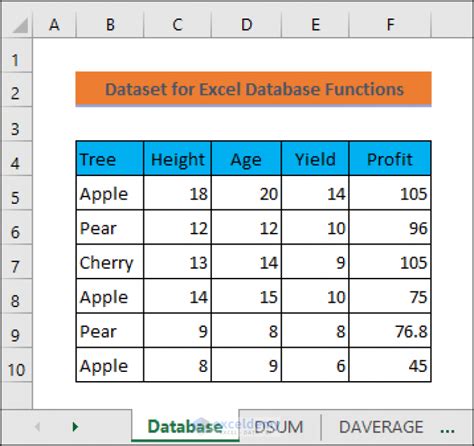
DSUMfunction is part of Excel's database functions and can sum values in a database based on criteria. Its syntax isDSUM(database, field, criteria).
For example, to sum values in column B for rows where the category in column A is "Electronics" and the region in column C is "North", you could use:
=SUMIFS(B:B, A:A, "Electronics", C:C, "North")
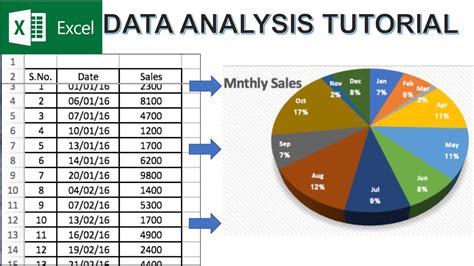
Practical Examples and Statistical Data
Let's consider a practical example with statistical data. Suppose you have a dataset of exam scores for students across different subjects. You want to find the total score for each subject to compare performance.
| Subject | Score |
|---|---|
| Math | 85 |
| Science | 90 |
| Math | 78 |
| Science | 92 |
| English | 88 |
Using the SUMIF function, you could calculate the total score for Math as follows:
=SUMIF(A:A, "Math", B:B)
This would give you the total score for Math, which in this case is 163 (85 + 78).
Gallery of Summing Values in Excel

Gallery of Excel Functions
Excel Functions Gallery


FAQs
What is the purpose of the SUMIF function in Excel?
+The SUMIF function is used to sum values in a range of cells based on a specified condition or criteria.
How do I create a pivot table in Excel to sum values by category?
+To create a pivot table, select your data range, go to the "Insert" tab, click on "PivotTable", choose a location, and then drag your category field to the "Row Labels" area and your value field to the "Values" area.
What is the difference between SUMIF and SUMIFS functions in Excel?
+The SUMIF function allows for a single criteria range and criteria, while the SUMIFS function allows for multiple criteria ranges and criteria, providing more flexibility in summing values based on different conditions.
As you explore the capabilities of Excel for summing values in the same category, remember that practice makes perfect. Experiment with different functions, pivot tables, and scenarios to deepen your understanding and proficiency. Whether you're analyzing sales data, student scores, or any other type of data, Excel's robust set of tools is there to help you uncover insights and make informed decisions. Don't hesitate to share your experiences, ask questions, or provide tips on how you use Excel for data analysis in the comments below.